Haytor climate data
I have now been recording the weather at Haytor for over 20 years and so it is useful to summarise the actual data. Such a summary of period averages and extremes comprises the local climate of Haytor.
| 2003-2023 | Average monthly rainfall (mm) |
Average maximum temperature (ºC) |
Average minimum temperature (ºC) |
Average number of days snow lying (more than half cover) |
Average number of days sleet or snow falling |
Average number of days with an air frost |
Total number of days with thunder over the years |
| January | 195 |
7.3 |
2.1 |
2.9 |
6.0 |
7.7 |
10 |
February |
145 |
7.5 |
1.9 |
2.2 |
6.2 |
8.1 |
2 |
| March | 137 |
9.5 |
2.6 |
1.1 |
4.0 |
5.5 |
5 |
| April | 91 |
12.7 |
4.1 |
0.0 |
1.4 |
2.5 |
5 |
| May | 103 |
15.3 |
6.8 |
0.0 |
0.1 |
0.1 |
13 |
June |
92 |
18.5 |
9.6 |
0.0 |
0.0 |
0.0 |
15 |
July |
96 |
20.1 |
11.4 |
0.0 |
0.0 |
0.0 |
12 |
August |
115 |
19.5 |
11.2 |
0.0 |
0.0 |
0.0 |
19 |
September |
95 |
17.5 |
9.7 |
0.0 |
0.0 |
0.0 |
10 |
October |
193 |
13.8 |
7.8 |
0.0 |
0.1 |
0.5 |
15 |
November |
190 |
10.0 |
4.6 |
0.3 |
1.1 |
2.3 |
15 |
December |
208 |
8.0 |
3.0 |
1.8 |
3.2 |
6.0 |
6 |
| YEAR | 1659 |
13.3 |
6.2 |
8.4 |
22.2 |
31.8 |
127 |
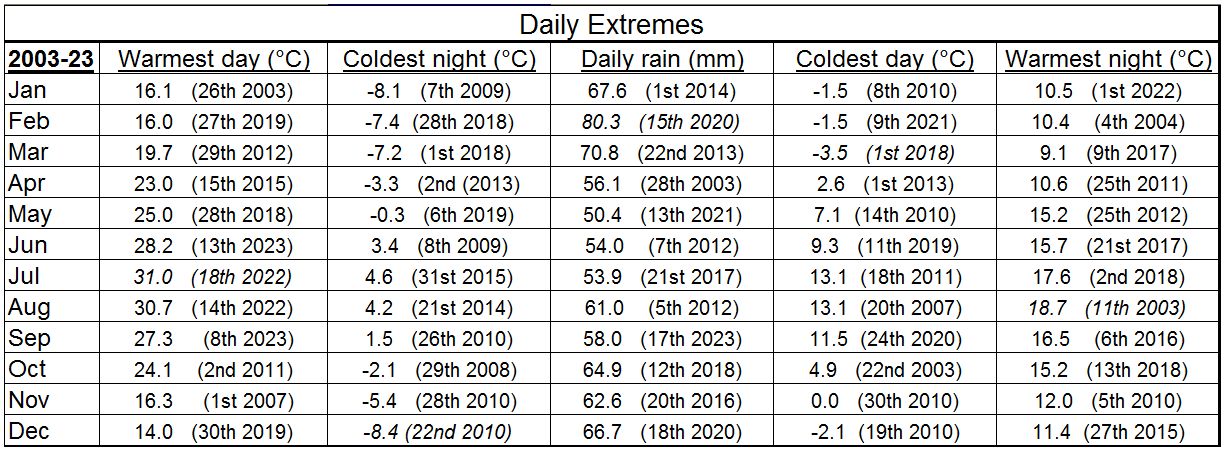
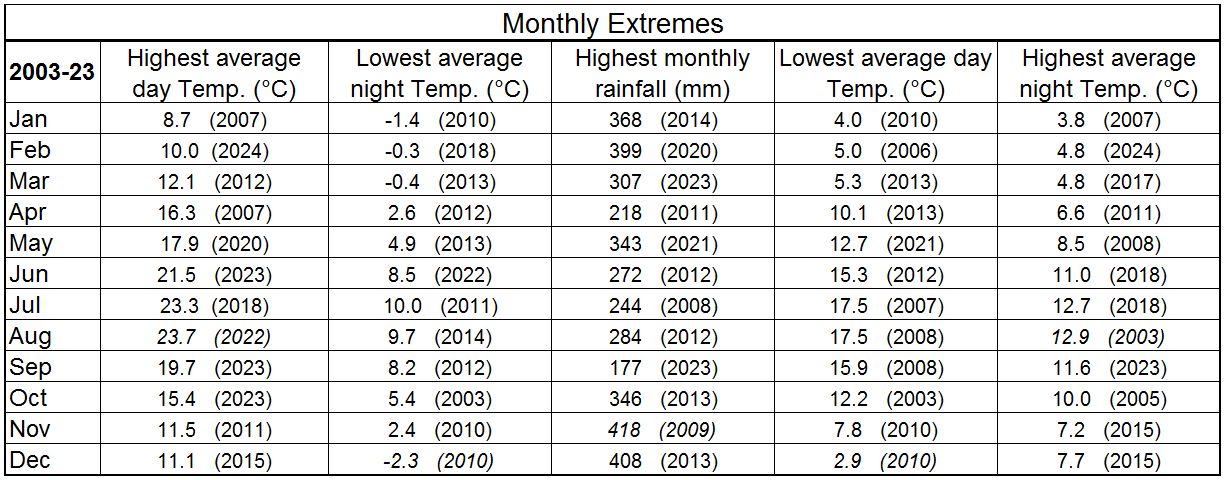
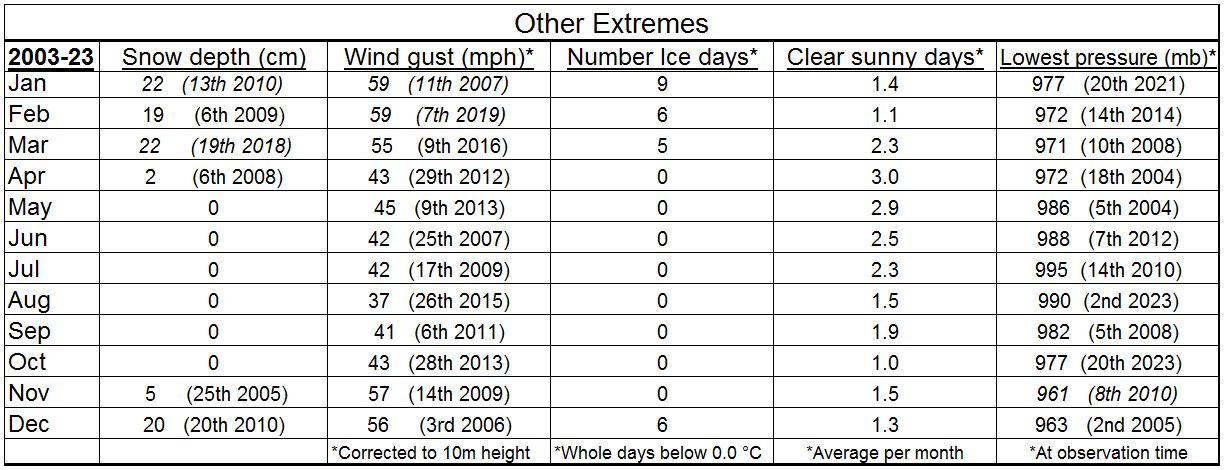
Extremes of weather in the past 21 years (up to end of 2023) are given in the tables below. There is a wealth of detail in here. For example, the warmest day in Haytor occurred on 18/07/22 with 31.0ºC; the wettest day was on 15/2/20 with 80.3mm and the lowest pressure recorded at Haytor was on 8th November 2010 with 961mb. The warmest month was August 2022 with an average maximum temperature of 23.7ºC and the sunniest month in Haytor is April (closely followed by May).
Hope you enjoy looking at these figures and perhaps seeing them beaten in the years to come!
Winter snowfall
Not surprisingly snow has never fallen here in Haytor during June, July, August and September since I moved here in 2002. It has been very rare too in May and October, but I have chosen the period October to May as the "winter" period.
The graph below shows the number of days in each winter when sleet or snow fell between 0000 and 2359 hours. Also shown are the number of days when snow was lying covering more than half the ground area at 0900 GMT each morning. Days with patchy snow cover were not recorded. If snow was lying then the maximum depth (in cms) for the winter is shown.

This graph clearly shows that snowfall has been highly variable in the past 20years. However, snow is guaranteed to fall in Haytor every winter and on most winters it lies at least for a few days. This is not so for low-lying coastal parts of Devon where snow is very rare. The deepest snow occurred in winters 09/10 and 17/18 with 22cm recorded. The winter of 11/12 was notable for very little snow cover but snow did fall out of the sky on 20 days. The least snowy winter was 06/07, 21/22 followed by 06/07.
The present overall trend for snowfall is for a decrease in "snow-lying days" of 3 days per decade and 4 days per decade for the number of days when snow falls. That is very alarming as it implies that if this trend continues then by the year 2080 snowfall in Haytor will be rare.
Monthly rainfall
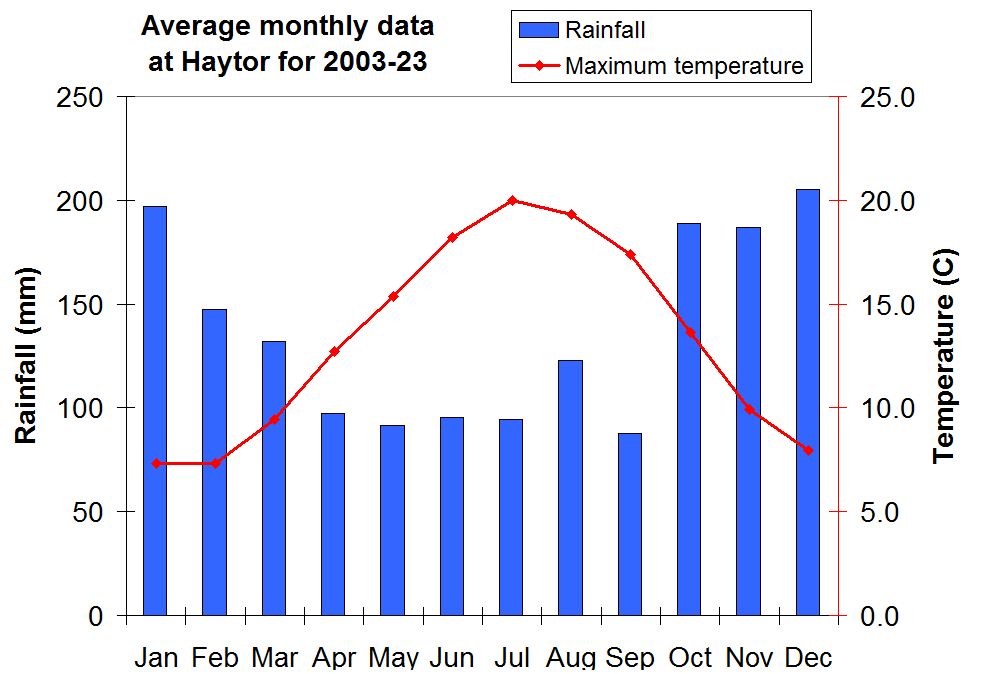
The graph below shows the amount of rain recorded (in mms) each month.

The wettest month was November 2009 with 418mm (equivalent to more than half an inch a day every day). The driest months were September 2014 (3.5mm) and June 2018 (3.1mm), which was exceptional. Clearly rainfall is copious at Haytor with most falling during winter and autumn and I have recorded 14 months so far with over 300mm. The winter of 2013/14 was especially wet with Dec, Jan and Feb all recording over 350mm totals.
The present overall trend for rainfall is for an increase in annual totals of about 14 mm per decade but with Summers becoming drier. Winters have become considerably wetter with an increase of 92 mm per decade. At this rate of change 2080 will see around another 500 mm of winter rainfall. Shocking.
Monthly temperature
The graph below shows for each month the average maximum temperature, average minimum temperature and mean temperature.
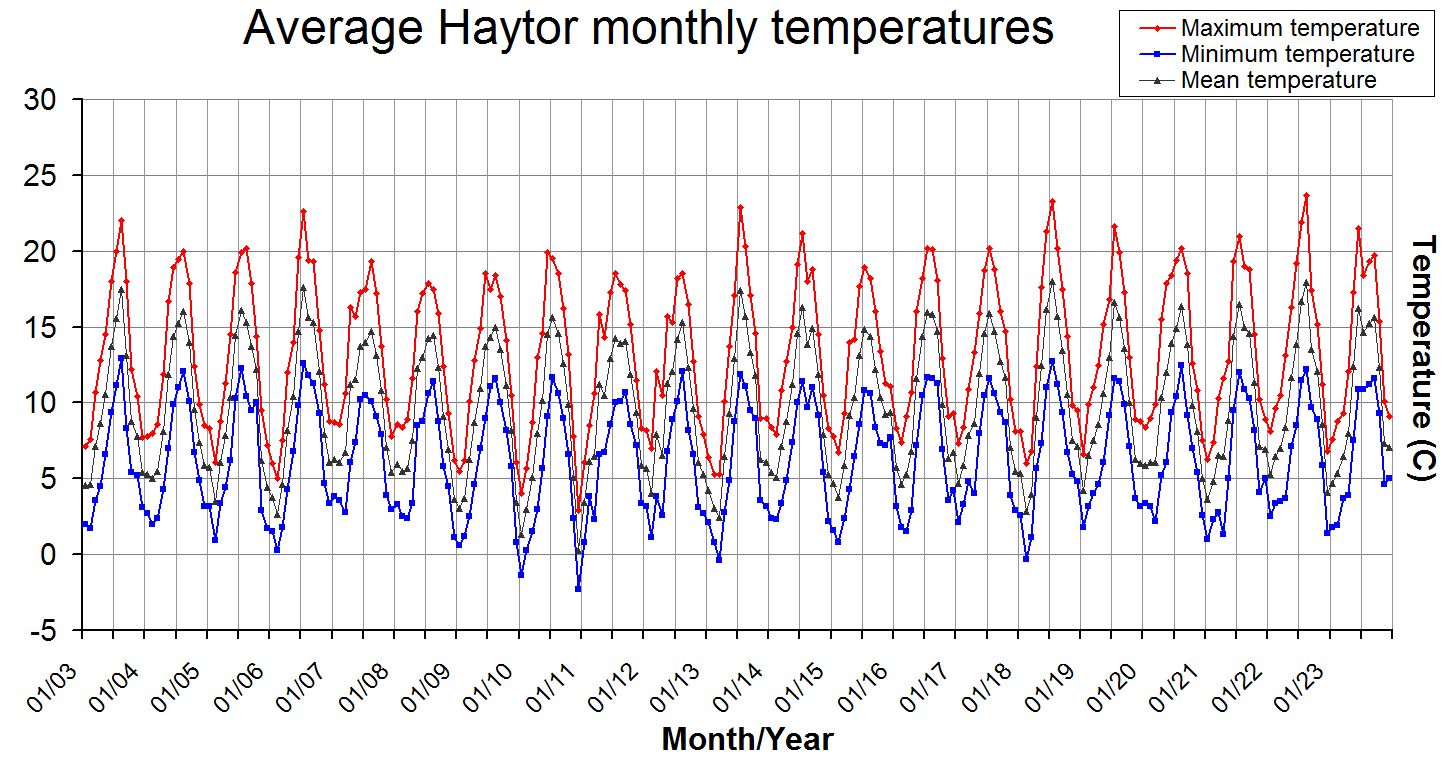
The warm summers of 2003, 2006, 2013, 2014, 2018 and 2022 clearly stand out. The very cold December in 2010 also stands out with a mean temperature just above freezing. But the most notable month is the exceptional mildness of December 2015 with a mean minimum temperature of 7.7ºC (which is close to the normal maximum temperature).
The present overall trend for average temperature is for an increase of 0.39ºC per decade (3.9 degrees per century which is very alarming).
The graph below shows average maximum temperature and rainfall for each month.
Air frost
The graph below shows the average number of days of air frost (lowest temperature < 0.0ºC) in each month.
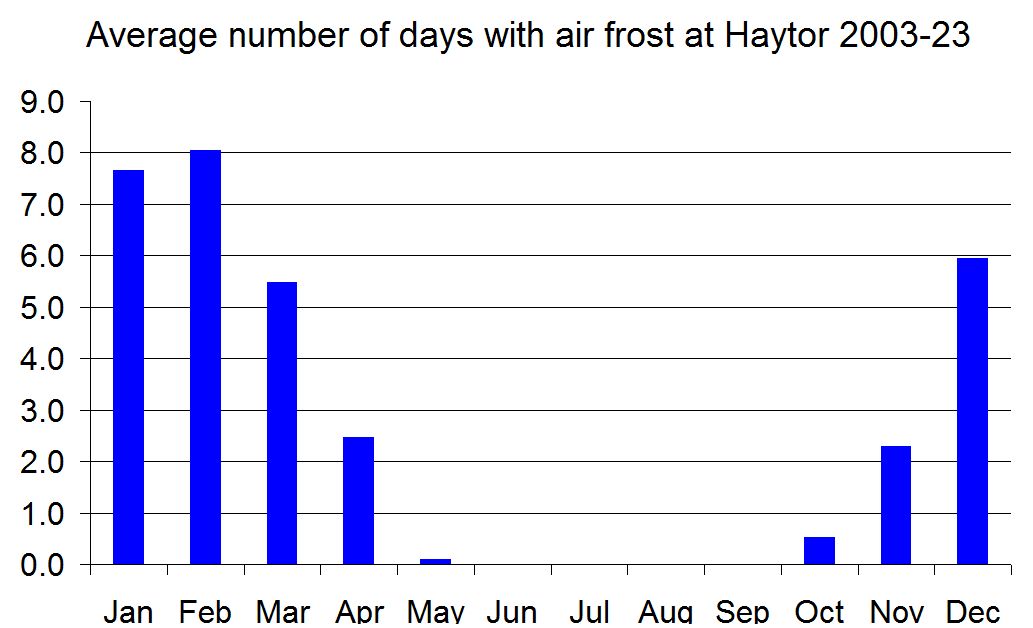
Obviously for growers it is important to know that air frosts can occur from October to May with the main season running from November to April. February tends to be the most frosty (and icy) month.
Thunder
Thunder is not very common on Dartmoor, however, I have recorded each day when thunder was heard. The graph below shows the total number of days thunder was heard over 19 years for each month.
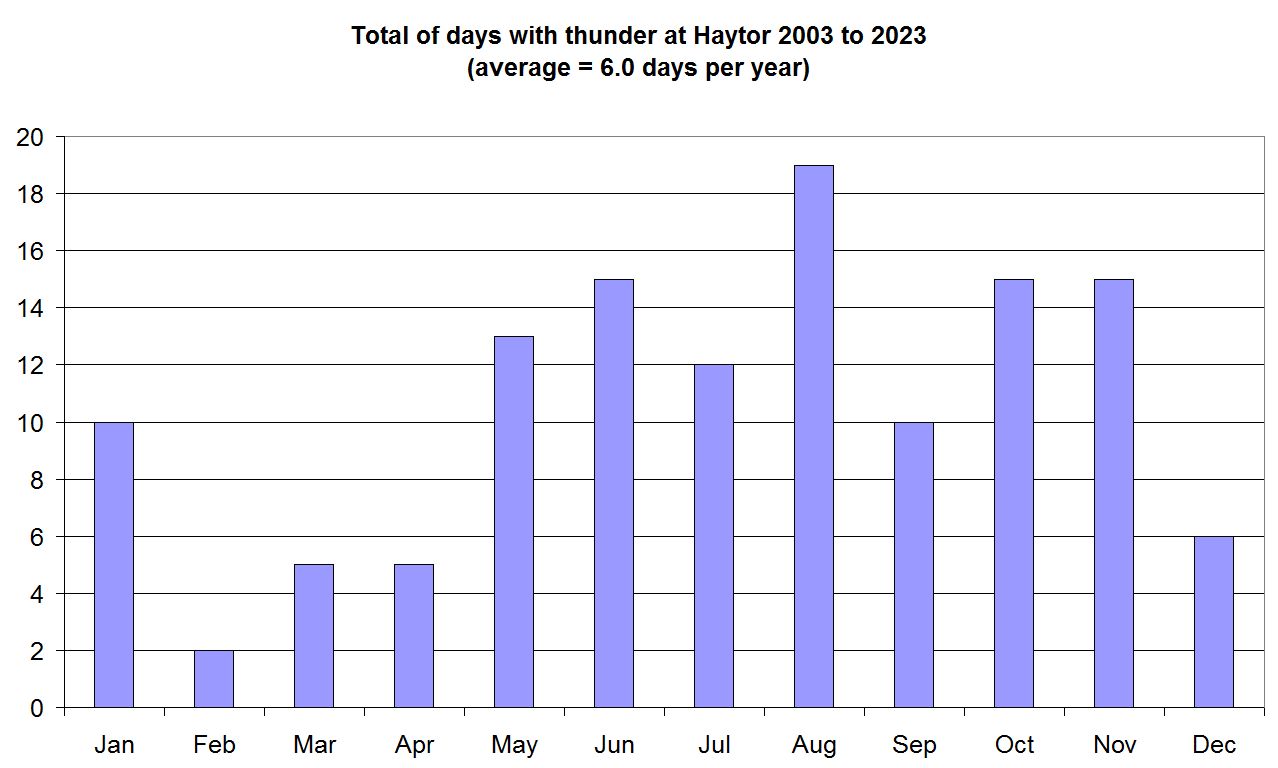
The average number of days when thunder can be heard is about 6 per year. The most thundery month tends to be August although this can vary from year to year. The month which is least likely to have thunder is February with only two occurences in 21 years.
Sunshine
Over the years I have noted days which were completely sunny from dawn to dusk. The graph below shows the average number of such days for each month.
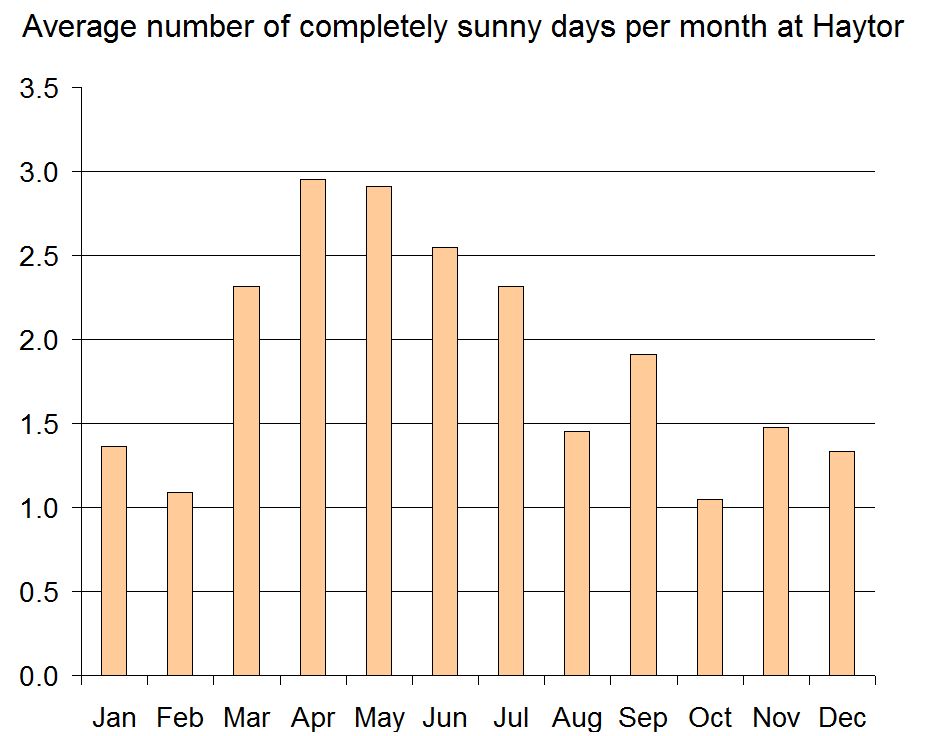
Perhaps surprisingly the sunniest month is April closely followed by May and indeed the whole of the Spring/early summer period has the most completely sunny days. The least sunny months are February and October.
Earth temperatures
Each day at around 6 pm I take soil temperature readings at four depths: 1cm, 10cm, 30cm and 60cm. These are useful as a guide for planting and sowing. A graph showing the average soil temperature at 60cm depth in each month from January 2003 is shown below.
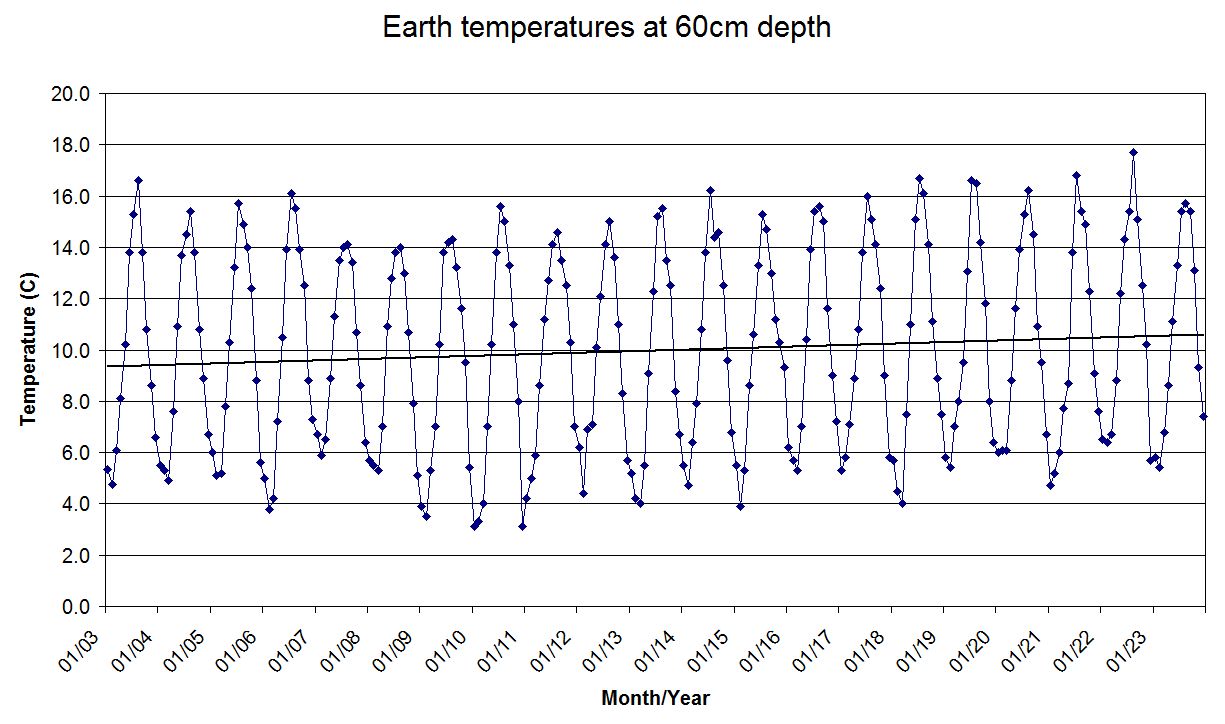
The deep soil temperature varies from around 4ºC or 5ºC in Winter (nearer 3ºC in cold periods) to just over 15ºC in Summer. However, in recent years the temperature has regularly exceeded 16ºC in Summer. The trend is upwards, rising at a rate of around 0.56 degrees per decade. In time this could allow a greater variety of plants to become established in Haytor.
Estimated climatological averages for 1971-2000
These averages have been estimated using long term records for Teignmouth and Princetown and then checked against nearby Yarner Wood for consistency. Haytor is almost precisely midway between Teignmouth and Princetown, so the averages have been derived by interpolating linearly in height above sea level.
| 1971-2000 | Rainfall (mm) |
Maximum temperature (oC) |
Minimum temperature (oC) |
| January | 183 |
6.8 |
1.8 |
| February | 142 |
6.7 |
1.6 |
| March | 133 |
8.3 |
2.7 |
| April | 92 |
10.5 |
3.8 |
| May | 86 |
13.6 |
6.7 |
| June | 95 |
16.4 |
9.3 |
| July | 88 |
18.6 |
11.6 |
| August | 110 |
18.4 |
11.7 |
| September | 129 |
15.9 |
9.7 |
| October | 175 |
12.6 |
7.2 |
| November | 188 |
9.4 |
4.5 |
| December | 209 |
7.8 |
2.9 |
| YEAR | 1629 |
12.1 |
6.1 |
With these it is instructive to compare my actual data for 2003-2023 to the estimated data for 1971-2000 to see if there are major differences.
Plotted below are graphs of monthly mean temperature differences and average monthly rainfall difference.
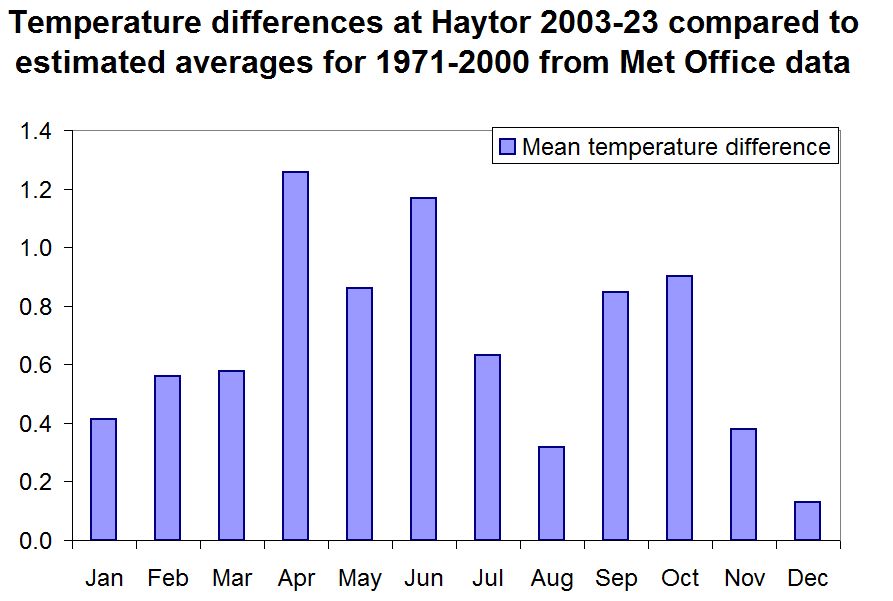

A warming trend is evident (+0.7°C mean); this fits in reasonably well with the observed warming trend of 0.39°C per decade measured between 2003 and 2023. However, Decembers have not changed much and Springs are much warmer. Rainfall shows a mixed signal, overall marginally wetter (29 mm per year), however, in recent years the trend has been for increased rainfall, especially in winter. Septembers have noticeably become a lot drier in the 21st Century.
Finally, and in addition to the numerical averages, I am gradually building up experience of other various weather elements:
WIND - the site is relatively sheltered for winds from all directions except from the easterly sector. To the east there is a long sea fetch along the English Channel from Belgium. However, depressions can still bring periods of westerly or southwesterly gales at times and the most damaging wind direction locally is a gusty west-northwesterly.
RAIN - rain falls often and in copious quantities, although not as much as on the western side of Dartmoor. Often it consists of many small droplets and drizzle is common. The heaviest rain tends to occur with SE'ly winds. September has become notably drier over the years.
SHOWERS - these occur at all times of the year and tend to be most frequent from mid-morning to early evening. Haytor tends to miss the heaviest of the showers in north or northwest airflows as they preferably run down the Teign valley to the east. In westerly winds the high moor gives shelter but frequent showers can occur from other directions apart from NE. Rainbows are common and are often vivid and double.
SNOW - Major, disruptive snowfalls with drifting are rare, although occasionally Haytor has been completely cut-off for a short time with moorland roads remaining difficult for a week or so. Small falls of 1-2 cm in northerly airstreams are not uncommon but these tend to melt during the day. Sleet or wet snow 'falling but not settling' occurs quite often in winter. The level for lying snow seems to be around 250m asl with places below that seeing very little in most winters.
FROST - Very low temperatures are rare but days with penetrating frosts with temperatures near freezing accompanied by wind are not uncommon. On the exposed moor wind chill needs to be considered if out walking in winter. Autumn and late spring frosts seem to be infrequent. Generally there is usually too much wind and cloud for persistent frosts.
THUNDERSTORMS - These can occur at any time of year and can be spectacular in winter. Major storms are rare, however, in summer local storms occasionally develop just to the east giving torrential downpours. Very occasionally high level thunderstorms will migrate north from France, usually overnight and early in the morning.
SUNSHINE - During summer most sunshine occurs early in the morning and in the evenings. During the day cloud often builds over the moors while the coast stays clear. Anticyclones and ridges often bring the longest sunny spells.
FOG - Hill fog is common at all times of the year but especially in autumn and winter in southwesterly airflows when it can be dense and long lasting. Quite often radiation fog can occur lower down but remain wonderfully clear at Haytor above the temperature inversion.
CLOUDS - Clouds of all types are commonly observed. Sunrises can be spectacular and lighting effects can be dramatic at any time of the year. Cumulonimbus anvils are frequently observed, especially in winter and spring.
Will Hand
Chief Meteorologist for Haytor Weather Station
April 2024